

Build dashboards and annotate charts
LangAlpha can show an answer as a picture in five ways, and the agent picks one from what you ask: a widget inside the chat, a Python chart saved as an image, an HTML report file you keep, a live dashboard served from your computer, or annotations drawn on a live price chart. This page says what each one is, how to ask for it and what you get, so you can name the one you want.
Example request
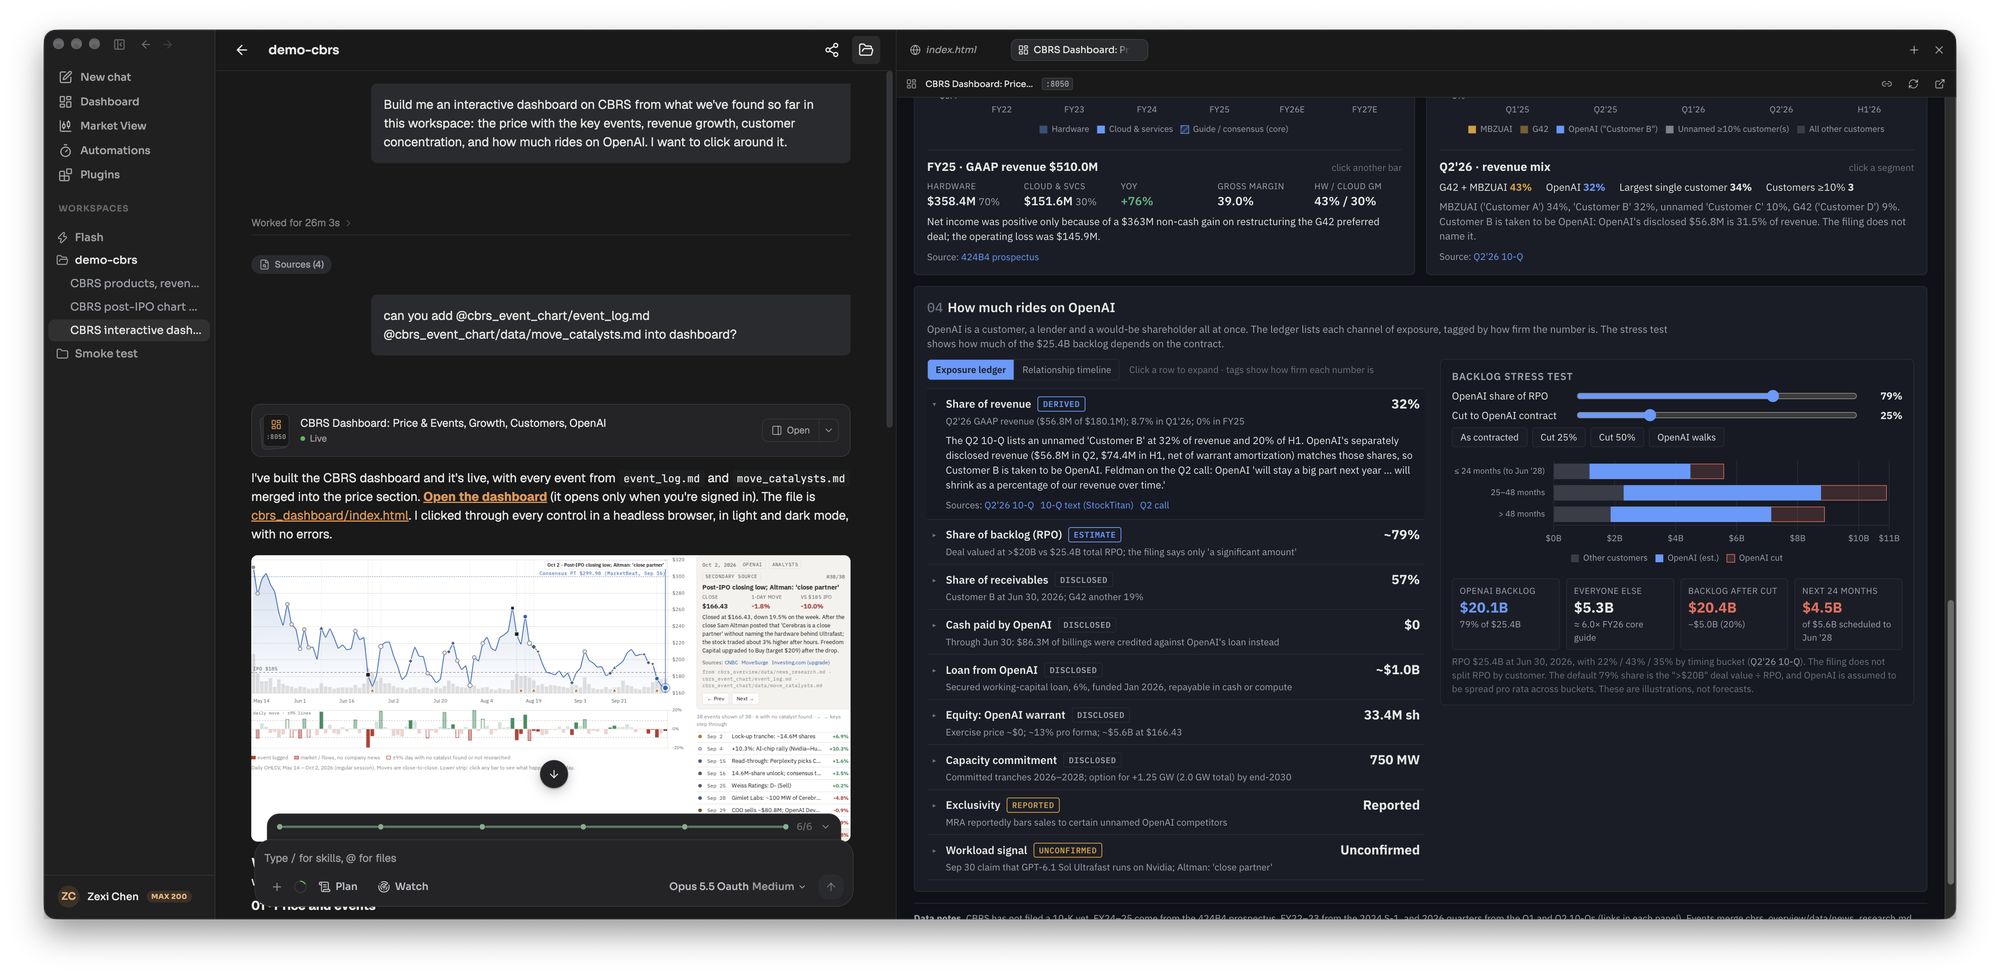
Section titled “Example request”Build an interactive dashboard of how much of Cerebras’s backlog rides on OpenAI, with the exposure ledger and a stress test, and merge in the event files from the other thread.
This is the dashboard request in the screenshot below. The agent builds the app in the workspace and opens it beside the chat.
Which output to ask for
Section titled “Which output to ask for”| You want | Ask for | What you get | Where it lives |
|---|---|---|---|
| One chart, a metric row or a small table inside the answer | A quick chart or table in the chat | An interactive widget between the text, with data embedded in it | In the thread only, no file |
| A figure for a document | A chart for the report | A static image the agent draws with code | A file in the workspace |
| A page you keep, print or send | An HTML report | One self-contained .html file | A file in the workspace, with a PDF export |
| Live data, server-side logic or a multi-page app | An interactive dashboard | A running web app opened in a side panel | A preview that works while the workspace runs |
| A level, a pattern or an event marked on a stock’s price | Annotations on the chart | Drawings on a live chart | The chart, opened from a card in chat |
The skills behind these are inline-widget, html-report, interactive-dashboard and chart-annotation. The widget skill hands off to the dashboard skill when you need a multi-page app, live refresh or a server.
What the agent does
Section titled “What the agent does”Widget. It renders HTML or SVG straight into the chat, can pass it files from the workspace, and can make it interactive with sorting, toggles and hover. It can use common chart libraries from a CDN, and it cannot call other web addresses.
HTML report. It writes one styled file into the task folder. In the file panel it runs as a page, and you can view it fullscreen, open it in a new tab, download it, or save it as a PDF with a footer, page numbers and scale you set. Charts and tables are interactive, working over the data embedded in the file. See Write an initiation report for one in use.
Interactive dashboard. It picks the simplest tier that works: a single HTML page, a FastAPI app with an HTML front end that polls for fresh data, or a FastAPI back end with a React front end for filtering and several pages. It then serves the app and opens it in a preview panel. The preview is live while the workspace runs, so for something you keep, ask for an HTML report.
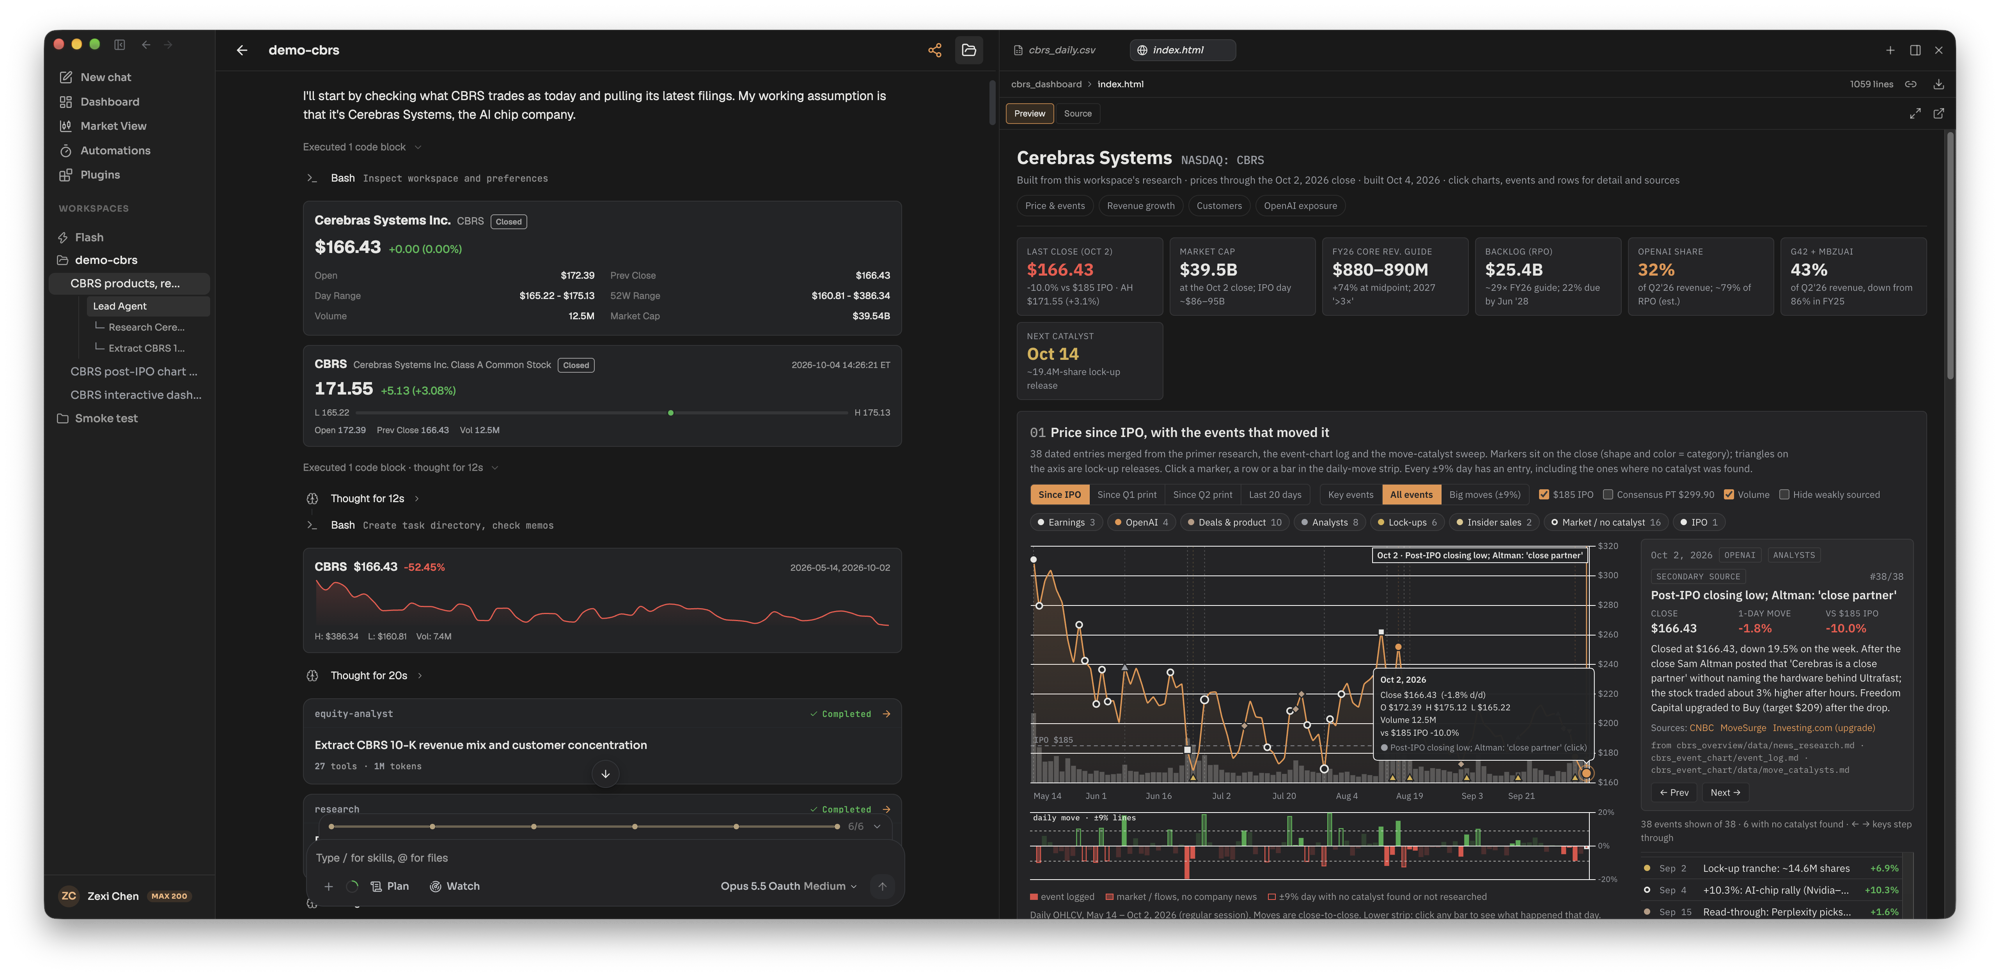
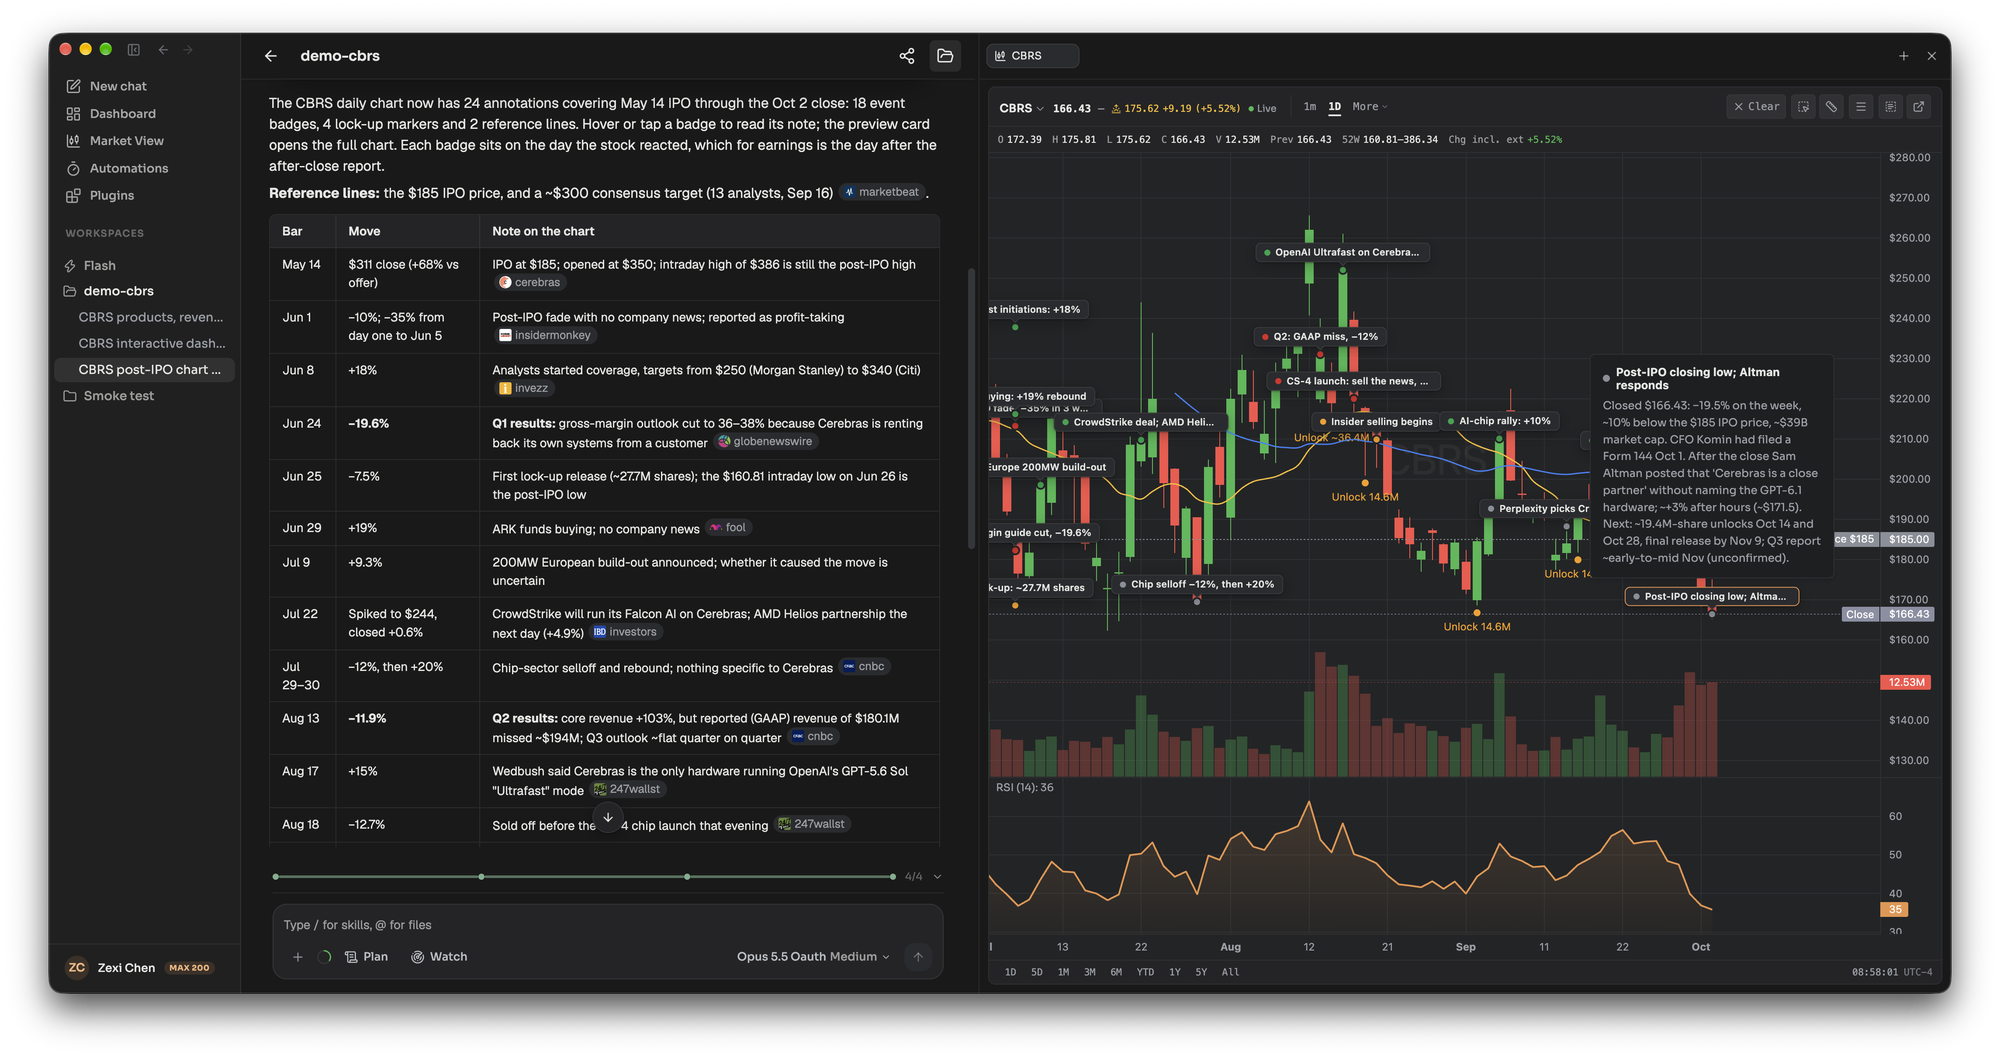
Chart annotation. It calls a drawing tool with the ticker and timeframe, and the drawing lands on the live chart. Charts are identified by ticker and timeframe, so “NVDA, 1 day” and “NVDA, 1 hour” are separate charts, and several can be drawn in one turn. The types are price line, trendline, marker, vertical line, rectangle, text, event badge and Fibonacci retracement. You do not need to be on the chart page. Elsewhere in the app the drawing appears as a chart card in the chat, and clicking it opens the live chart beside the conversation. You can also select a region or a price level on the chart and send it to the agent, which then answers about that selection.
Your own dashboard
Section titled “Your own dashboard”Separate from what the agent builds, the Dashboard page is yours to arrange. It is one page made of widgets. Until you save a layout of your own you see the Morning Brief layout: a markets overview, the AI daily brief, your portfolio and watchlist, market news and an earnings calendar, with a chat box floating at the bottom of the page.
Click the pencil in the page header to edit the layout. A toolbar then offers four things:
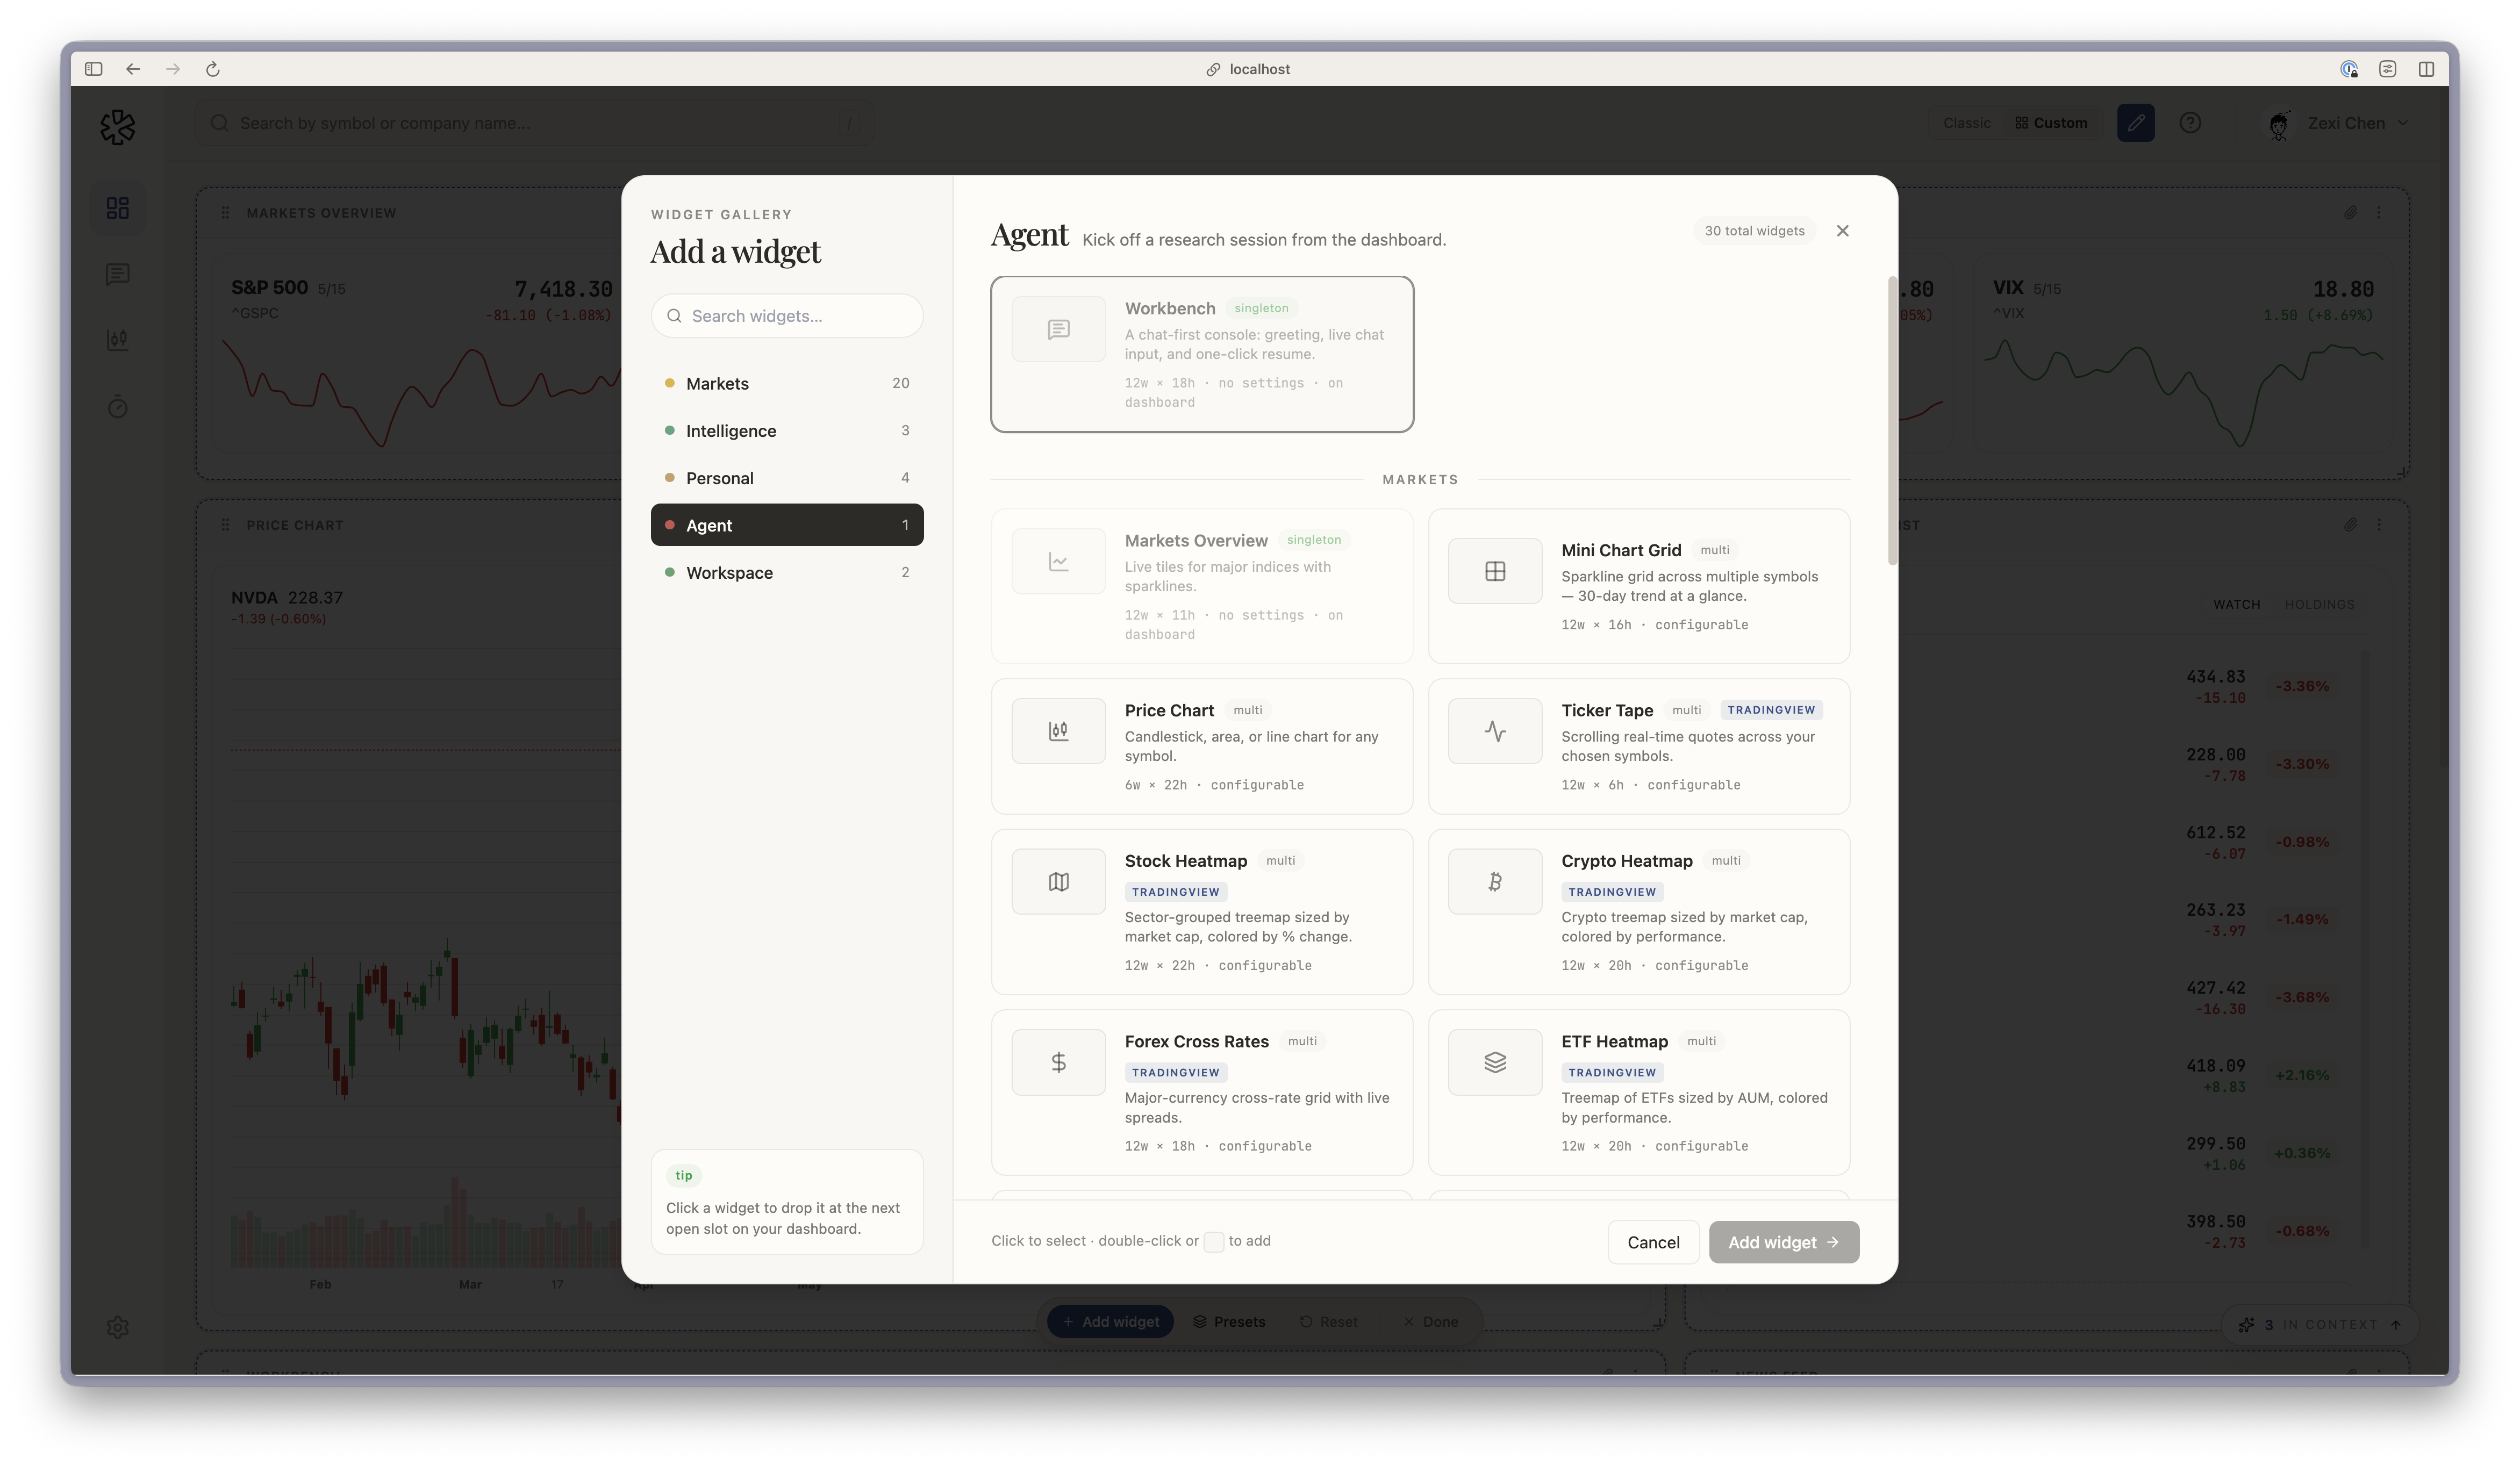
- Add widget opens a gallery of 30 widgets across Markets, Intelligence, Personal, Agent and Workspace, with search.
- Presets replaces the layout with one of six: Morning Brief, Agent Desk, Researcher, Trader, Trader (TV) and Portfolio Steward.
- Reset returns to Morning Brief, replacing your widgets and layout, and cannot be undone.
- Done leaves edit mode.
In edit mode you drag, resize and remove widgets. Looking at the default layout saves nothing, and your layout is saved from your first edit on. The Portfolio + Watchlist widget switches between your watchlist and your holdings. The AI Daily Brief widget has a Generate Personalized Brief button that writes a brief from your watchlist and portfolio. If you add the Workbench widget, a chat box that can also resume a recent thread, the floating chat box goes away.
On a phone the dashboard shows the same widgets in one column, in the order the desktop grid reads them. Editing is a desktop feature, so the pencil does not appear there.
- Name the output. “A chart in the chat” and “a report I can send” get different files, while “a dashboard” gets a running app.
- Ask for a Python chart when it belongs in a document. The annotation tools are for looking, and the skill itself says to draw a Python chart when the output is a deliverable. You can ask for both.
- Use the live chart for levels. Ask “what are the key support and resistance levels for NVDA?” and the agent can mark them where you can pan and zoom.